Dow Jones Industrial Average Facing Make or Break Situation
November 13th, 2008WARNING: This is not a recommendation to buy, sell or hold any financial instrument.
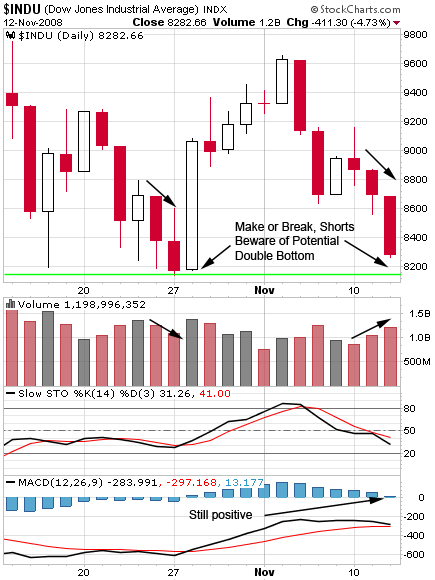
The Dow is facing a strategic price level at around 8200. Right up front, I want to state that I have no idea which way it’s going to break. What I can say, though, is that a violent move is probably coming, one way or the other.
I just bought some ridiculously risky November GM calls, strike 7s. Here’s my logic:
1. The news is universally grim.
2. Shorts are happier than pigs in slop.
3. There’s a potential double bottom dead ahead on the Dow.
Is Hank going to try to paint a double bottom on that Dow chart?
I don’t know, but if he does, it could touch off an astonishing short squeeze.
Hank says he’s all about buying equity positions in the banks now. If American Express can become a “bank” overnight to qualify for the lolly scramble, what other nonsense lies ahead?
If the Dow starts going up from here—that is, if Hank starts buying Dow futures—shorts will be gazing down the barrel of a double bottom and the Soviet Ministry of Glorious Free Markets and Plunge Protection.
Are there reasons to believe that 8200 will break to the downside.
Yes.
Obviously, the trend is down, but look at the volume.
Notice how the October low was put in on declining volume? One factor in trying to determine if you’re looking at a reversal or a continuation pattern is the volume; in general, increasing volume confirms the trend. If the trend is up, volume should be increasing. If the trend is down, volume should be increasing. If an asset is either rising or falling on declining volume, watch out, a reversal may be at hand. (See: Divergence.)
On the Dow, the signals are very blurry.
We have a potential double bottom ahead, but the volume has been increasing on the down days.
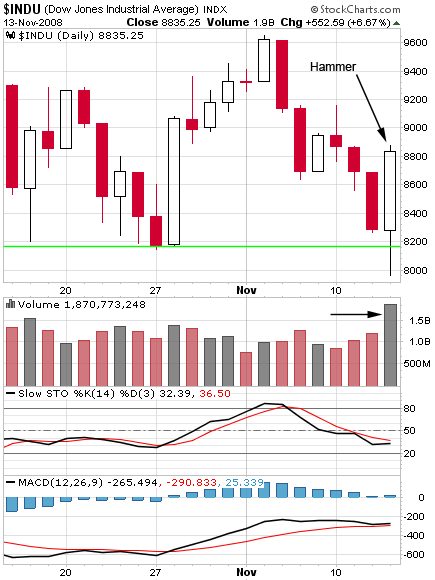
The thing to watch for today will be a bullish hammer. In other words, the Dow makes a new low, but then Hank and his Merry Plunge Protection Team force a positive finish—wait for it—near this 8200 level.
If They can paint a hammer on a double bottom, this would be a pants shitting development for the bears. I’m not saying that it’s going to happen, but keep an eye out for it just in case.
Below 8200 I’d expect to see massive program selling kick in.
Update: The Hammer Is In
Welcome to Market Manipulation and Painting Candles with Hank Paulson.
He botched his signature at the end, however, with a gain of 6.67%. Nice effort though.
Of course, now, the question is: Will follow through occur?
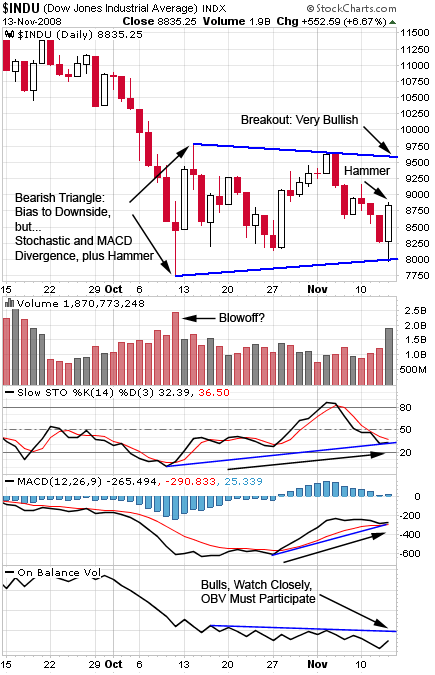
While the bigger picture shows a bearish triangle, MACD and stochastic divergence, coupled with yesterday’s hammer call the validity of the bearish triangle into question.
Contrarian swingers will look at taking on long positions during the next intraday pullback, with the stop being a break below the lower triangle line. I wouldn’t chase this if it keeps running. Wait for a pullback.
Take profit on declining volume at the upper triangle line, pare it, or let it ride long, depending on your appetite for risk. I would be very careful with any immediate shorts in the face of that hammer. Additionally, as we approach options expiration (November 21), the most crooked crooks (and the most cunning outsiders) stand to make the most money.
Bulls, watch your on balance volume. If any sustained nonsense crank rally is going to happen, OBV needs to participate, trending higher with the index. Moves higher, on decreasing volume or flattening OBV should be seen as potential shorting opportunities. If that happens near overhead resistance levels, watch out.
* phew * I need to go wash dirty nappies now.


I agree with your analysis with two caveats:
1) the actual indu low for the year is at approximately the 7880 level: this 8200 is a local bottom, but not the true db. i think a short squeeze from the yearly low is entirely possible, and if it does work, it could retest the local high at 9650: if that fails, then we could easily get 11425 … as crazy as that sounds
2) my magic 8 balls are showing me 7500, then 8750, then more down, to tgts: 6875, 6250, 5625, 5000 all with the requisite contra bounce on first being tested.
as with everything else, caveat lector.
🙂
cybele
Hi Cybele,
My crystal ball is VERY blurry now. What do you make of that symmetrical triangle on U.S. Dollar Index right now?
I’m trying to reconcile a dollar breakout higher with the gold COT report showing commercials with multi year low short positions.
Higher dollar seems to point to lower stocks, if the recent mechanism of sell-stocks-hold-dollars is anything to go by.
I’m terrible at calling short-term moves — especially lately — but I’d agree that we seem to be set-up for a solid rally somewhere in here pretty soon.
Last week Jimmy Rogers said he’d advise investors to start loading-up on this ridiculous commodities fire-sale that’s going on, and that he felt we’d seen an exhaustion sell-off (he also offered that the Fed was made up of idiots who were “always wrong” and that anyone who listened to these clowns was an idiot as well and that the Fed should be thrown-out altogether…). If this IS an exhaustion sell-off, then certainly there’s tons of cash sitting on the side-lines — so much that T-bills are basically worthless.
Ultimately my feeling is that, if this is truly a multi-generational bear-market, then it will find a way to continually shake-out any certainty that investors have whatsoever. So just as there was no way oil could go back under $60, just as there was no way T-bills could be considered “at risk”, so too will have to go the present “certainty” of sitting in cash. And the best way to do that would be to sucker a good bit of that cash back into the game.
What if the PPT finished their job a week ago, and what we’re now seeing is “natural” (hahaha) market forces at work? They’ve done their bit for God and country, kept the markets moving until the election, and now they’re taking a well-deserved and hard-earned vacation. 🙂
Then there’s the web bots over at halfpasthuman.com which are supposedly predicting some interesting event around Nov 14. Market crash? There’s some fascinating volatility in play right now on the DJIA.
Wow Kevin! Great job!
On borrowed time now for the real!
$150B treasury auction they only found suckers
for $12.5B of that.
China’s failout paid for with their $ surplus?
Awesome call Kevin! The double bottom appears to be here for the short term. I would guess we rally into options expiration (Nov 21) and then — WHAM — a re-test of the Oct 10 low of 7800 in the Dow.
Considering today, was this mostly program trading then? On CNBC this morning the mentioned that fear on the tradinf floor was still very present at the end of the day.
Steve