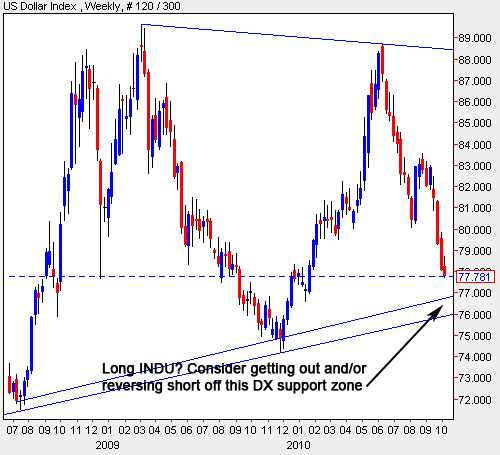
Reminder: Possible DX Support Ahead
October 5th, 2010Warning: This is not a recommendation to buy, sell or hold any financial instrument.
Gold is sharply higher today, with the spot metal reaching a new record high of $1342.30.
Let’s look ahead a few days to a couple of weeks.
Gold may pull back a bit if DX sees the support ahead, but the really interesting show could be INDU to the shortside. INDU longs should be careful in the 11,000 – 11,250 zone. There’s a potential double top in there that may be about to sync with support on the DX. If the DX rallies with the Dow somewhere between 11,000 – 11,250, we could be looking at a sharp sell off on the equities.
If this set up happens, I’ll consider buying November puts on DIA.


Kevin, I’d like to understand this stuff a bit more.
DX = Dollar Index (but also Debt Exchange in NZ)
INDU = Dow Jones Global Index
DIA = Dow Jones Industrial Average
Right?
Are you saying:
1. In the short term, if the apparent upward trend on US dollar support continues, then Gold may drop.
2. In the slightly longer term there may be an upward trend in the INDU and DX and then…people will sell their shares (“sell off on the equities”)???
3. If this looks like the direction things are going you’ll put your money on the Dow dropping again.
?
DX = U.S. Dollar Index
INDU = Dow Jones Industrial Average (Dow 30)
DIA = Symbol for SPDR Dow Jones Industrial Average (an ETF that tracks the Dow 30)
1. In the short term, if the apparent upward trend on US dollar support continues, then Gold may drop.
Yes, I think it will drop, but there’s so much financial trouble around the world, my guess is that it will hold up well. So, the question is, how much will it drop? Maybe enough to form another solid pivot point. According to some standard snake oil, I see good support around $1250.
2. In the slightly longer term there may be an upward trend in the INDU and DX and then…people will sell their shares (“sell off on the equities”)???
I’m concerned about the Dow 30 forming a double top as the dollar index finds support (as indicated on the chart). I thing there’s a decent chance of stocks selling off pretty hard somewhere from the 11,000 to 11,250 range.
3. If this looks like the direction things are going you’ll put your money on the Dow dropping again.
Yep, if the Dow 30 gets over 11K, I’ll buy put options on the DIA ETF.
ALL the world’s markets can be viewed on one page at
http://www.reuters.com/finance/markets/indices
@Kevin,
Thanks for that. I am slowly educating myself about this stuff.
Cheers 🙂
@Dennis
You’re welcome.
The premise I’ve laid out above should be considered to have been wrong if the Dow 30 starts printing daily green candles over 11,250. On the dollar index, red candles below that lowest triangle line means the 74 zone is the next target on the downside.
And thank you Peter…I’ve bookmarked that one.
Yes, sitting there in the dentist’s office (I kid you not) this article in the issue of Rolling Stone caught my eye.
http://www.rollingstone.com/politics/news/17390/204277