Gold and the Dollar: Countertrend Elliot Wave Cycles Completed
May 24th, 2009WARNING: This is not a recommendation to buy, sell or hold any financial instrument.
DISCLOSURE: I own gold. I am a BullionVault client and affiliate.
Summary: My best guess is that, on balance, gold is headed higher and will break above the high of $1032 set back on 17 March 2008. I’ve written on balance because there is going to be a lot of noise and volatility along the way as market participants struggle with the reality of the situation on the dollar. With regard to a timeline on the breakout occurring: Less than six months is my best guess. Short term (days to a couple of weeks): expect selling; lock and load to buy dips above around $875.
Technical Analysis: To my squinty eye, gold is carving out a giant pennant. A bullish pennant alone isn’t really enough to go on, so I looked at the dollar for insights and noticed (with my other squinty eye) a completed bullish Elliot Wave cycle; the classic 5-3 pattern.
As gold and the dollar move roughly opposite to each other, I looked back at gold and—squinting hard enough—I counted five bearish waves on the weekly interval. I know. That’s arguably not a bearish Elliot Wave wave sequence on gold, but since the bullish pattern is so clear on the dollar, I really tried to see it.
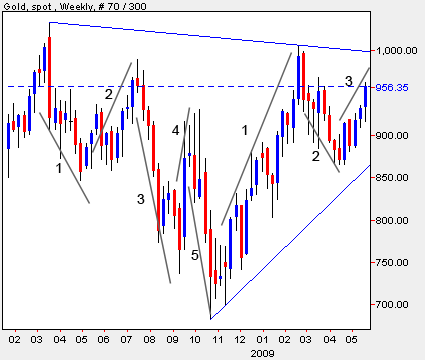
Spot gold, weekly interval

U.S. Dollar Index, weekly interval
Another bearish indicator on the U.S. Dollar Index is the formation of a Dark Cloud Cover/Hangman on the March 2009 candle. (Not illustrated here.)
I think we’re setting up the next phase (fractal) of the multi-year, uptrend on gold. Note the fairly obvious impulse wave beginning at the end of 2008. While the dollar would have a long way to fall to break below the previous all time low, I’m not convinced that the low would need to be taken out for gold to break higher. At this point, it’s much easier for gold to break out higher than it is for the dollar to break down and out of the range. That said, know that the dollar will eventually encounter hard support around 71-72.
It’s easy to turn Elliot Wave theory (or any other form of technical analysis) into a fully nuts study on apophenia, so I like to keep this stuff pretty simple. In summary: The argument for being long gold is a bullish Elliot Wave sequence occurring inside a quasi bullish pennant, meanwhile, on the dollar, we note a completed bullish Elliot Wave sequence. The monthly Dark Cloud Cover/Hangman candle adds more support for this view. Whether or not that “a” wave on the dollar index is a correction wave or, in fact, a new bearish impulse wave “1” is a matter that Elliot Wave practitioners might want to debate.