U.S. Dollar Index Breaches Significant Weekly Supports
April 14th, 2007Yesterday, in Gold: Switch Off Your Targeting Computer, I wrote:
The U.S. dollar has been clobbered and may be technically oversold. While the U.S. dollar is in a descending triangle pattern now (bearish), it has also formed a creepy double bottom on weekly charts (bullish). So, what is it: a double bottom, or a descending triangle?
Let me consult my Magic 8 Ball…
My best guess is that this is not a bottoming formation on the dollar, and that the downtrend will continue. Why? The subprime mortgage paper apocalypse is spreading to “lower†risk paper in the Alt-A liar loan category. That might be bullish for the dollar is some weird Plunge Protection Team kind of way, but I doubt it otherwise. I wouldn’t be surprised if we see a fakeout bounce on the dollar before the long red candles start bleeding down computer screens everywhere.
Technically, it hadn’t formed a weekly double bottom when I wrote that. It just looked like it was going to.
Well, it didn’t. As the day finished out, rather than a bounce, we wound up breaching the weekly range and close supports.
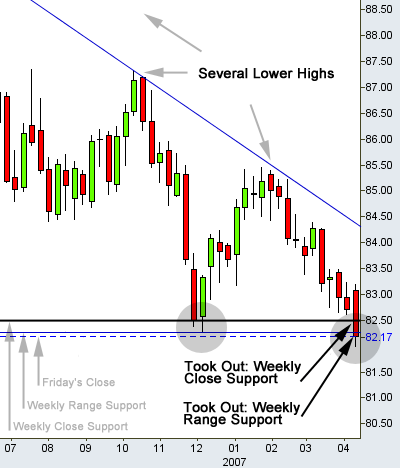
I haven’t bothered you guys with charts before, but this one is worth examining. This is a weekly U.S. Dollar Index chart. The last red bar on the right is yesterday’s close.
I drew shaded circles to indicate the the critical support levels. The thick black line is the weekly close support level. The thin blue line is the weekly range support level. The dotted blue line is Friday’s close.
That’s a definite breach of the weekly range and close support levels.

Weekly USD Index with Decending Triangle and Supports Taken Out
Ok, what does this mean?
I’m not trying to make traders out of you guys, or frighten anyone, but there is a good chance that we are about to lose cabin pressure on the U.S. Dollar.
Note the trendline following the lower highs downward? As that line approaches the support line underneath, think of the situation as building pressure. (Read more about descending triangles.)
I have seen several of these setups breach supports and then bounce, but I have more often seen this result in a strong and sustained move down.
I said previously that I wasn’t going to put exact numbers on this because of all the shakeouts that occur at times like this: but what the Hell, why not? If support/manipulation to the upside is going to occur, look for it as soon as Monday. If a situation like this isn’t followed up by strong buying, and soon, traders will interpret it as bearish and they will lean on it hard.
If it bounces, there will be no way to know if it is real. Only a lunatic, or someone who knows the future, would chase a rally on this thing long. If it rallies, it’s probably a fake out move to squeeze shorts out before the bottom falls out. I’d short any pop up to about 83, stop limit 83.17.
But, if there is downside follow through, the next two key support levels to watch for are 81.43 and the last chance holdout, 80.85, where several countries might try to circle the wagons. 80.85: That’s the (weekly) low, set back in December of 2004. Beijing and Tokyo (or someone, read on) MUST pour the support on here, or the sharks will smell blood in the water.
The perfect storm has been gathering strength for years; out of sight and out of mind for most people. We might be seeing the combined effects of real estate, oil and the intertwined federal deficit/national debt crisis.
If Beijing and Tokyo do not intervene here, the veil between worlds could become thin… Again.
In 2004, private banking clients in the Caribbean and London suddenly began buying billions of dollars worth of U.S. debt when the Asians threw in the towel and the bids dried up at the Fed’s bond auctions. Look at the U.S. Dollar Index for that period. Yes, that’s right. That 80.85 support level I mentioned above was established in 2004, after months of sustained selling. It’s nice to get a little help from your anonymous, private banking friends with billions of dollars to spend on U.S. funny money debt paper.
Well, here we are again. Is it going to be black ops banking and private accounts in the Caribbean that prop this pig up for another few weeks or months?
I certainly don’t know.
This is just a warning with a bit of context. Whatever happens, don’t get caught by surprise. Use this time to review your contingency plans and maintain a heightened state of vigilance over the next week or so.

[…] operator on our farm helping us with our major projects, so I’m outside today. Please review U.S. Dollar Index Breaches Significant Weekly Supports. That recent analysis is now breaking news. Posted in Announcements | Trackback | Top Of […]