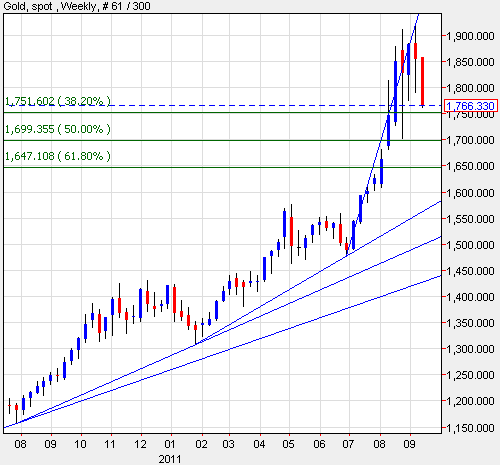
Gold: Weekly Interval
September 16th, 2011Warning: This is not a recommendation to buy, sell or hold any financial instrument.
On gold, I’m focusing on the weekly interval after the unwinding of the recent double top on the daily.
As of now, there is no damage to the long term bullish technical picture on gold. It’s debatable where long term damage would occur, but the three supporting trendlines on the chart below offer rough guidelines. Nearer term, I think support is likely ahead as the relevant Fibonacci retracement levels are reached.
On the standard retracement levels, I see the 50% at ~$1700 as having a better chance of providing a good swing low than either the 38.2% at ~$1751 or the 61.8% at ~$1647.
A move below the 61.8% at ~$1647 sets up the trendline support that’s about to pass through $1600.


I’m not very technically minded with charts and all, although I think I understand the idea. But I’ve read a few opinion pieces recently that lead me to believe gold is entering a parabolic phase which might mess up things like “standard retracement levels” — but more importantly, I think that we’re in unprecedented times with global fiat currencies collapsing, resource depletion, population overshoot, climate change, endless wars, and all the other lovely realities of our day. Given all the volatility in the world, I would think that the charts might be misleading at best. Just some deductive reasoning that’s not scientific in the least.