Cisco’s Sub Second Melt Up and Identifying Crop Circles in the High Frequency Market Data
August 5th, 2010WARNING: This is not a recommendation to buy, sell or hold any financial instrument.
Last week, Cisco (CSCO) was halted because the new “circuit breaker” rule kicked in. The price had moved more than 10% in five minutes (ABC/Reuters):
Trading in Cisco Systems Inc shares was briefly halted on Thursday after triggering a circuit breaker.
According to the Nasdaq website, trading was paused due to a move of 10 percent or more in Cisco’s price in a five-minute period.
Cisco fell 1.7 percent at $23 in mid-day trading.
Thomson Reuters data showed a single trade at $26, which would have represented a more than 10 percent move. The halt started at around 10:41 a.m. EDT (14:41 GMT), and trading resumed five minutes later.
NYSE Amex, where the trade occurred, said in an e-mail that all trades will stand after it had reviewed those executed at 10:41 a.m. between $23.67 and $26.
Unless you know a bit about how Cisco behaves in the market, you might not have thought much more about this.
I used to watch Cisco all day and it just doesn’t move violently like that. CSCO is an extremely liquid stock. The daily volume (3 month average) is around 60 million shares. It meanders in a slow, nauseating grind, a penny at a time. I thought I’d bring up a minute chart to see how the action played out during this halt event.
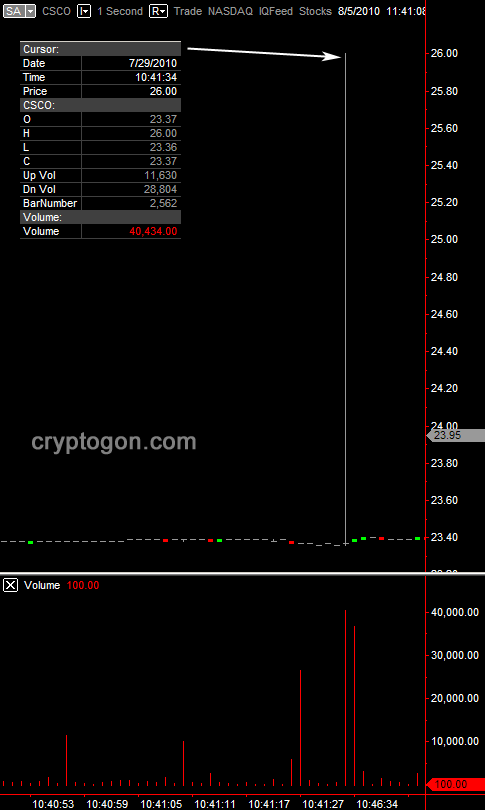
There was just one whacked out upper candle shadow on the minute chart; it actually looked like bad data, but it wasn’t.
I went to a 30 second interval. Same weird upper candle shadow. Ten second. Same thing again. Five second. Two second.
One second, and still, just one upper shadow to $26.
“What the… This happened in under a second?!” I mumbled to myself in total disbelief. The circuit breaker is meant to kick in on moves that happen over five minutes. What all the news about this incident on Cisco fails to mention is that the circuit breaking move happened in under a second.
So, I was looking at a one second chart that contained the whole incident! Here it is:
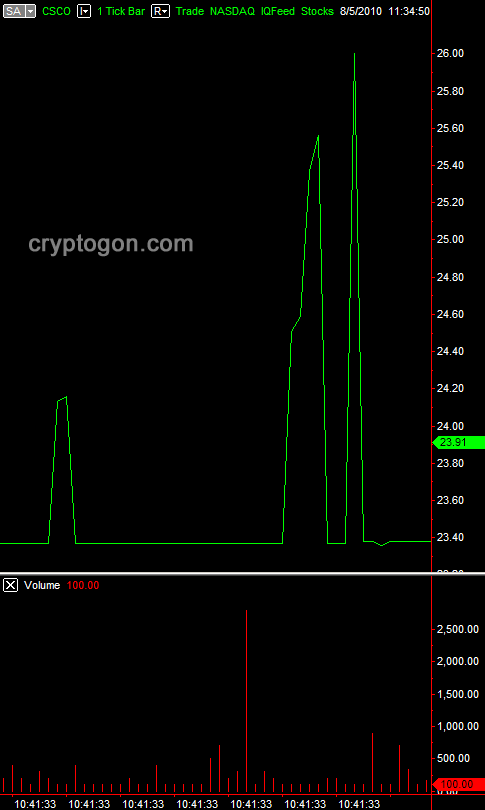
I had to drill down further, so I brought it up in tick.
Tick data shows us every change to the best bid and ask as well as the volume. Tick data has no fixed time component. The number of ticks that occur in a second, minute or hour depends on the instrument in question and the activity at any given time.
For mere mortals, tick data is the most detailed data available, and this is what you see below (Data: IQFeed, Charts: MultiCharts):
There’s a lot of room for the machines to iterate inside of one second, and so, for a few fractions of a second last Thursday, all Hell broke loose.
CSCO, the stock that normally grinds pennies for minutes or hours at a time, gapped violently (almost three bucks) higher as sell side liquidity disappeared. It didn’t just happen once, or twice inside that fateful second. It was the third gap higher that was far enough to trigger the kill switch.
This was no normal ramp job, with the price moving sharply higher in an orderly way. The sell side liquidity disappeared several levels deep, for some number of cycles, inside this second, and someone’s bot just kept trying to find shares higher and higher, until the exchange pulled the plug.
When, exactly, did this happen?
Well, that’s an interesting question. We’re looking inside the one second bar that ended 7/29/2010 10:41:34. I can’t be more precise than that because my tick data is only time stamped with seconds.
I don’t know who or what took out the sell side of the CSCO book, during those fractions of a second last week, but if this can happen to a stock like Cisco… You should be extremely concerned if you have more than pocket lint riding on stock market. This isn’t a functional market, where buyers and sellers are efficiently determining prices by their activities. This is machines juggling chainsaws.
The only reason I noticed was because a wheel came off the cart. Keep in mind, however, that this kind of thing is happening in all electronic markets, every trading day.
Now, let’s turn to the The Atlantic piece, “Market Data Firm Spots the Tracks of Bizarre Robot Traders,” which I’ve referenced below. A firm called Nanex, LLC. provides a set of tools that are used for developing trading systems that are capable of operating in timeframes measured in nanoseconds. Nanex started finding wild patterns of activity in these tiny slices of time. It’s a fascinating article, mainly because nobody has any good explanations as to what the Hell is really going on here. (Don’t miss Nanex’s Crop Circle of the Day – Quote Stuffing and Strange Sequences page.)
What’s even more fascinating is that millions of people are trusting their financial futures to this hyped up game of pong that has been left to run in autonomous mode.
Via: The Atlantic:
Mysterious and possibly nefarious trading algorithms are operating every minute of every day in the nation’s stock exchanges.
What they do doesn’t show up in Google Finance, let alone in the pages of the Wall Street Journal. No one really knows how they operate or why. But over the past few weeks, Nanex, a data services firm has dragged some of the odder algorithm specimens into the light.
The trading bots visualized in the stock charts in this story aren’t doing anything that could be construed to help the market. Unknown entities for unknown reasons are sending thousands of orders a second through the electronic stock exchanges with no intent to actually trade. Often, the buy or sell prices that they are offering are so far from the market price that there’s no way they’d ever be part of a trade. The bots sketch out odd patterns with their orders, leaving patterns in the data that are largely invisible to market participants.
In fact, it’s hard to figure out exactly what they’re up to or gauge their impact. Are they doing something illicit? If so, what? Or do the patterns emerge spontaneously, a kind of mechanical accident? If so, why? No matter what the answers to these questions turn out to be, we’re witnessing a market phenomenon that is not easily explained. And it’s really bizarre.
It’s thanks to Nanex, the data services firm, that we know what their handiwork looks like at all. In the aftermath of the May 6 “flash crash,” which saw the Dow plunge nearly 1,000 points in just a few minutes, the company spent weeks digging into their market recordings, replaying the day’s trades and trying to understand what happened. Most stock charts show, at best, detail down to the one-minute scale, but Nanex’s data shows much finer slices of time. The company’s software engineer Jeffrey Donovan stared and stared at the data. He began to think that he could see odd patterns emerge from the numbers. He had a hunch that if he plotted the action around a stock sequentially at the millisecond range, he’d find something. When he tried it, he was blown away by the pattern. He called it “The Knife.”
…
“When I pulled up that first chart, we saw ‘the knife,’ we said, that’s certainly algorithmic and that is weird. We continued to refine our software, honing the algorithms we use to find this stuff,” Donovan told me. Now that he knows where and how to look, he could spend all day for weeks just picking out these patterns in the market data. The examples that he posts online are just the ones that look the most interesting, but at any given moment, some kind of bot is making moves like this in the stock exchange.
“We probably get 10 stocks in any 10 minutes where we see something like this,” Donovan said. “It’s happening all the time.”
These odd bots don’t really make sense within the normal parameters of the high-frequency trading business. High-frequency traders do employ algorithms to look for patterns in the market and exploit them, but their goal is making winning trades, not simply sending quotes into the financial ether.
…
But the algorithms we see at work here are different. They don’t serve any function in the market. University of Pennsylvania finance professor, Michael Kearns, a specialist in algorithmic trading, called the patterns “curious,” and noted that it wasn’t immediately apparent what such order placement strategies might do.
Donovan thinks that the odd algorithms are just a way of introducing noise into the works. Other firms have to deal with that noise, but the originating entity can easily filter it out because they know what they did. Perhaps that gives them an advantage of some milliseconds. In the highly competitive and fast HFT world, where even one’s physical proximity to a stock exchange matters, market players could be looking for any advantage.
“They are moving the high-frequency services as close to the exchanges as possible because even the speed of light matters,” in such a competitive market, said Stanford finance professor Peter Hansen.


You have so much interesting info up here today Kevin. You probably are glad I don’t have time to comment on all of them.
I was thinking about my father tonight when I read this. Dad was a big believer in the stock market. When he lost on many of his stocks in 1967 he paced the floor at night. Could not sleep.
His work hours were from 5:00 a.m. to 5:00 p.m. Dad was miserable when he lost money in the stock market.
This a whole new ball game. Punks hacking into the system, the Plunge Protection Team, etc. Anymore, the stock market seems like a day in Las Vegas. There is nothing reliable in this anymore.
I don’t trust this funny money system. Cripe, I have refused to buy into the non-paper billing system. It seems like just another way to take control of our finances away from us.
These days, I think it would be better to put money in durable goods while they still can be made in China. You know, before the Yangtze dam surrenders under the weight of all of that uncured concrete.
Surely, all those corporations that have shipped those manufacturing jobs overseas are going to be begging us to work for them.
Roll of the eyes. Maybe the time is coming where we just say NO.
Rather be unemployed thank you, rather than invest my time, money, energy, or country into your meat grinding machine.
Bye, bye Goldman Sachs. Without stocks to churn and burn, what will happen to you? Lets have a pity party.
excellent commentary and research, Kevin.
it is a can of worms.
the fact that this is not being discussed extensively in the establishment financial press is suspiscious in itself.
and where are the other financial bloggers on this?
but cudos to the Atlantic.
i’m sure there will be more buzz around this topic in the next couple of years.